The Hidden Metric Top Shopify Stores Track (That You Don't)
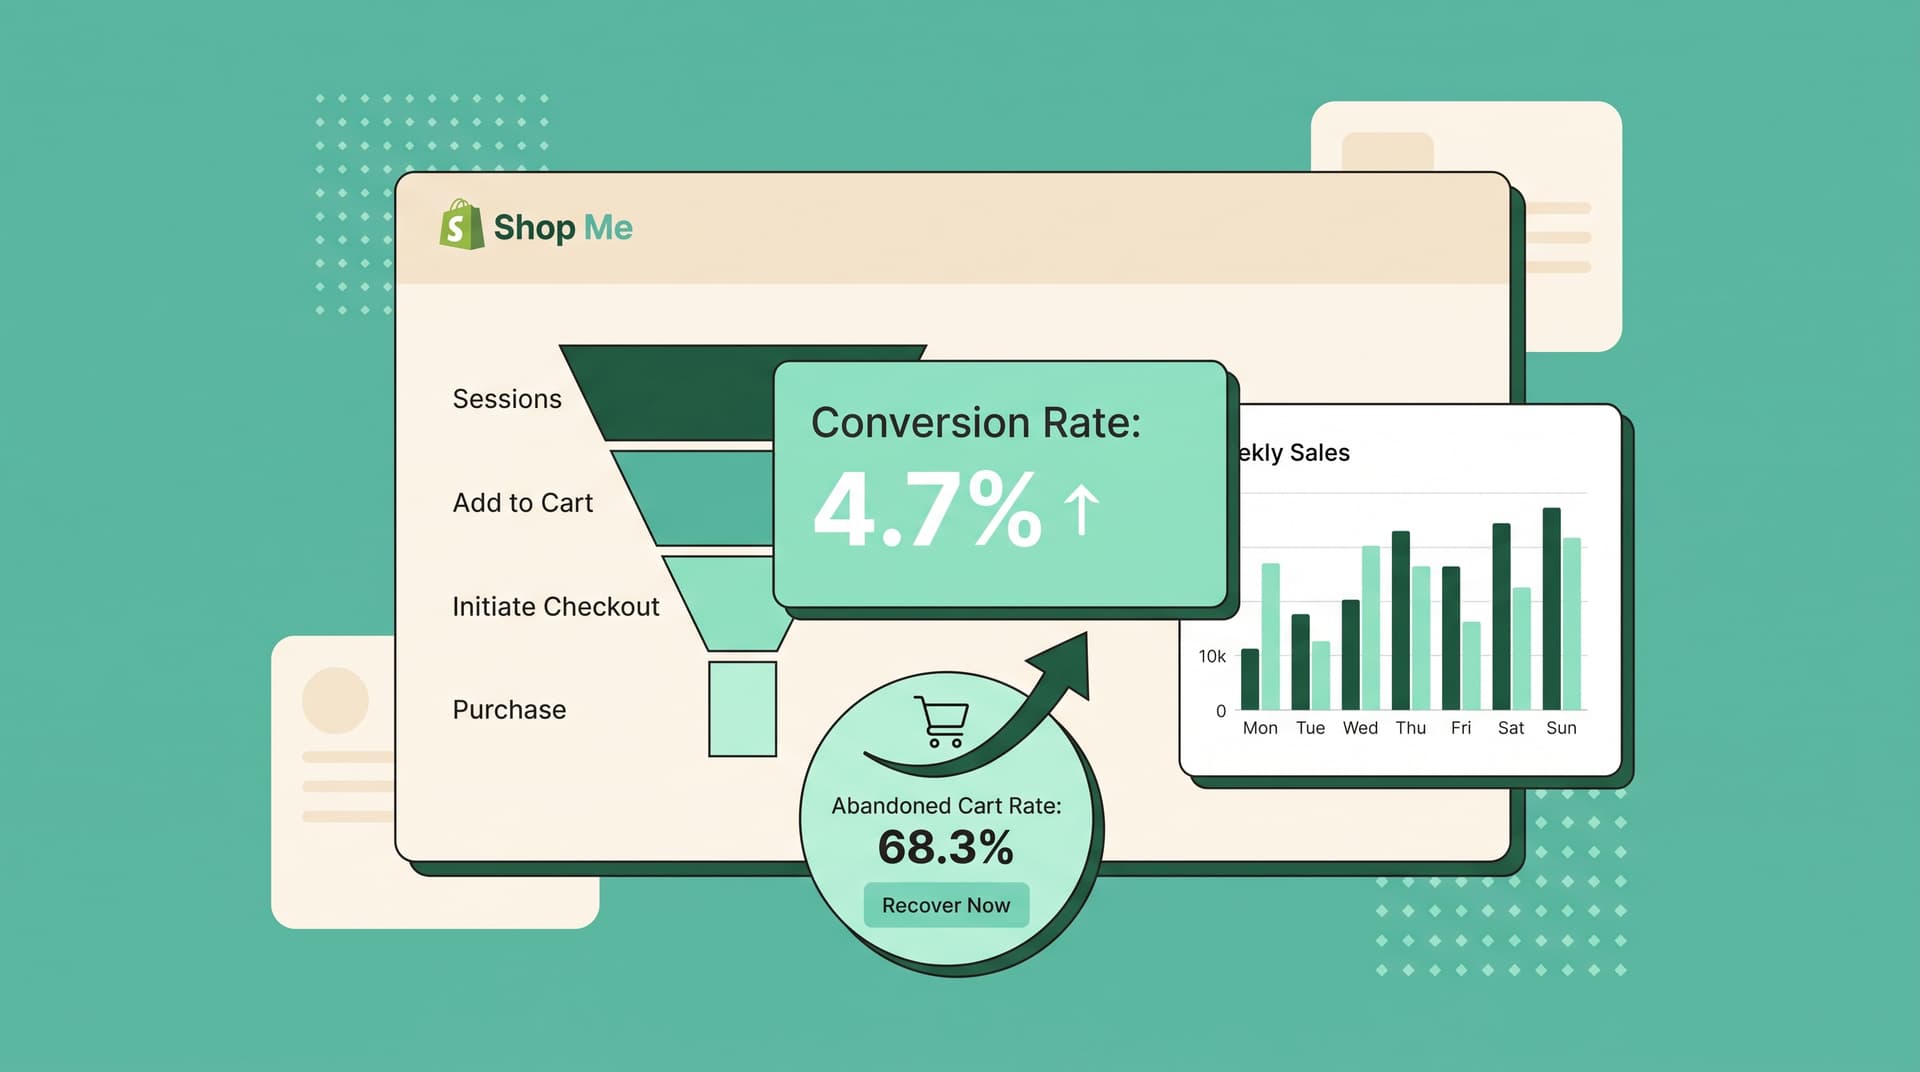
Most Shopify store owners glance at total sales and think they know how the store is doing. According to Littledata, the average Shopify conversion rate sits at just 1.4 percent. The top 10 percent of stores hit 4.7 percent. The gap comes down to one thing: they read their dashboard differently.
The stores pulling ahead do not just watch revenue. They track the real signals buried in the numbers.
Why standard reports hide revenue leaks
Shopify’s default analytics show the surface. You see sessions, orders, and total sales. What you miss are the silent leaks: people who almost bought, the exact moment they left, and why repeat buyers stop returning.
According to Baymard Institute, the average cart abandonment rate across ecommerce is 70 percent. Most store owners never connect that number back to specific product pages, traffic sources, or device types in their dashboard. That connection is what separates average stores from the ones scaling fast.
Three dashboard views growth experts check first
Smart owners start every morning with these three screens.
1. Conversion rate by traffic source
Open the Sessions report and add the conversion rate column. Desktop traffic often converts 0.7 points higher than mobile. If your paid ads are driving mostly mobile shoppers and conversion is stuck at 0.9 percent, you know exactly where to fix the landing page.
2. Add-to-cart rate vs checkout completion
Average add-to-cart rate on Shopify is around 4.6 percent. If yours is lower, your product pages need work. If add-to-cart looks fine but checkout completion is weak, the problem sits in shipping costs or checkout friction.
3. Repeat purchase rate by cohort
Create customer segments for first-time buyers from the last 30 days. Check what percentage comes back within 60 days. Stores that push this number above 25 percent grow much faster without extra ad spend.
What the numbers actually tell you
- Low sessions but strong conversion: protect your traffic source and raise prices.
- High sessions, low conversion: fix product imagery and trust signals.
- Strong conversion, poor repeat rate: improve post-purchase emails and bundle offers.
Each of these insights lives inside your Shopify reports once you know where to look.
Turn dashboard data into daily actions
Set two alerts this week.
First, flag any traffic source converting below 1 percent for more than 500 sessions.
Second, flag products with high add-to-cart but low purchase rate. These usually need better photos or clearer sizing info.
Reviewing these alerts takes five minutes. Acting on them moves the needle every single week.
Frequently Asked Questions
How often should I check my Shopify analytics? Open the main reports once a day and the deeper customer segments once a week.
What Shopify reports matter most for growth? Conversion by source, repeat purchase rate, and abandoned checkout recovery numbers.
Can I track customer conversations inside the dashboard? Native Shopify reports stop at basic numbers. Most owners add a tool that shows exactly what shoppers ask before they buy.
Why does my conversion rate look stuck? Usually because you are averaging across all traffic sources instead of splitting them out.
How long until dashboard changes show results? Most fixes appear in your conversion rates within 7 to 14 days.
Want AI like this for your store?
The first 25 brands get free beta access + an exclusive lifetime deal.
Start Free Trial